
5+ Years
48% of students have 5+ years of work experience.
The UC Berkeley School of Information (I School) welcomes applicants from around the world. Our online students come from diverse professional backgrounds and bring unique perspectives to information and data science.
As a student in datascience@berkeley, the online Master of Information and Data Science (MIDS) program, you’ll form close relationships with your classmates and instructors through online classes and in-person learning experiences.
The following class profile reflects incoming students from our May 2021, September 2021, and January 2022 cohorts.
32
Average Age
18–61
Age Range
33.5%
Women-Identifying
Current MIDS students are located in 20 U.S. states as well as in Canada, Mexico, and Singapore.
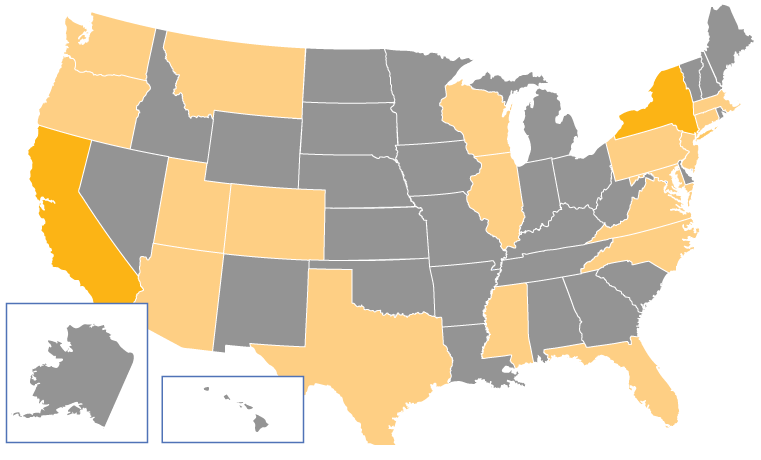
Map shows that MIDS students are located in Arizona, California, Colorado, Connecticut, Florida, Illinois, Maryland, Massachusetts, Mississippi, Montana, New Jersey, New York, North Carolina, Oregon, Pennsylvania, Texas, Utah, Virginia, Washington, and Wisconsin. The highest concentration of students is in California, followed by New York.
3.5
Domestic Students
2.46
International Students
5+ Years
48% of students have 5+ years of work experience.
Learn more about the online master’s in data science and how you can create lasting connections with students, faculty, alumni, and industry leaders.
1This percentage represents U.S. citizens or permanent residents who identify as Latin American/Latino, African American/Black, American Indian/Alaska Native, other Mexican/Mexican American/Chicano, Puerto Rican, or other Hispanic.arrow_upward
2These numbers represent the average scores of students who attended institutions that utilize a 4.0 GPA scale.arrow_upwardReturn to footnote reference